library(b2spm)
dem_chablais <- rast("mnt_chablais.tif")
# Computes the topography
topo_chablais <- topo_comp(dem_chablais)
# Fetches the DRIAS table on the ROI for 2050
drias_chablais_2050 <- drias_fetcher(topography, year = 2050)
# Runs the model for the Chablais in 2030
results_chablais <- pipeline(drias_table = drias_chablais_2050, topography = topo_chablais, return_tables = TRUE)
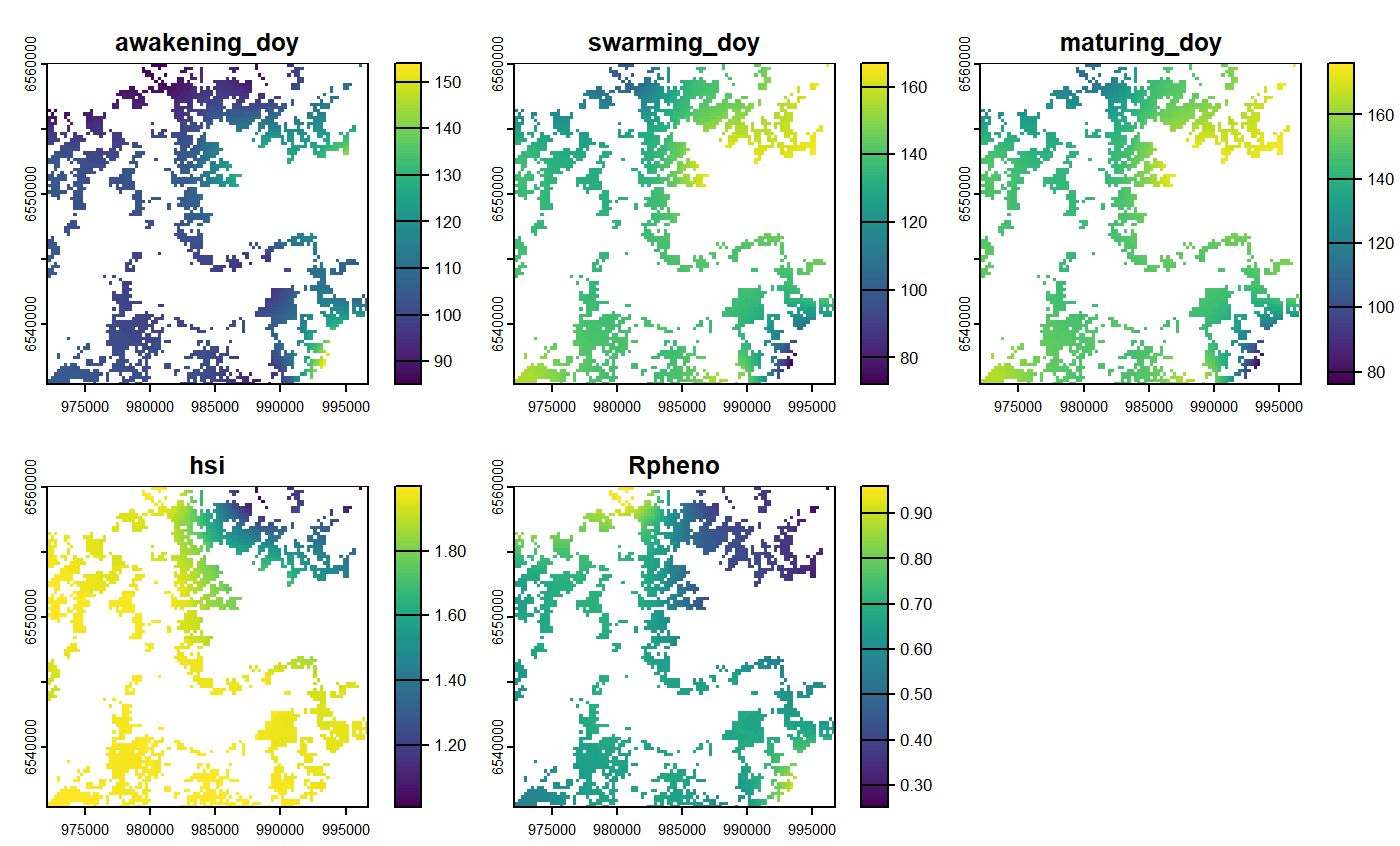
# Displays the epidemic risk map
plot(results_chablais$rpheno)